
Breaking Free: Navigating Golang's Memory Management
Part of the Go-In-Depth-Series, this time on memory management, stack, heap and escape analysis


Go’s Memory Management
Golang’s memory is divided into two areas, one for the stack and one for the heap. The stack is usually used for data with a known, fixed size that is determined at compile time, such as function variables and function call frames. It’s automatically allocated and deallocated as functions are called and returned. Each goroutine has its own stack frame.
On the other hand, the heap is usually used for global variables, local variables with a large memory footprint, local variables that cannot be reclaimed immediately after a function call. Other examples might include objects created with new or make and in the case of reference types, such as slices and maps, which store pointers to the underlying data, which in turn resides on the heap. Objects stored on the heap are shared between all the goroutines of a process. The heap is managed by the Go’s garbage collector.
Why is the stack faster than the heap?
Allocating variables on the stack is generally faster than if we do it on the heap. This performance difference is primarily due to the characteristics of how CPUs and memory access work. The stack is a region of memory that is often small and is closely tied to the execution of a specific thread or goroutine. As a result, the stack is more likely to reside in the CPU cache. Accessing data in the cache is significantly faster than fetching data from the main memory (heap). But let’s do some testing to prove it:
Allocating small objects to stack vs heap

We can see it’s around ~22.5x faster:

Allocating large objects to stack vs heap

Now it’s ~1,268x faster:

Allocating huge objects to stack vs heap

Now we can see its ~648,532x faster:

How does the compiler decide whether to put a variable on the stack or on the heap?
The size threshold when it comes to deciding whether a variable is allocated on the heap rather than the stack is determined by the compiler using some heuristic rules. Usually, small arrays (e.g., a few kilobytes) are more likely to be allocated on the stack, while larger arrays will most certainly be allocated on the heap. The exact threshold cannot be known and depends on various factors, including the specific compiler and its settings. The decision might also be subject to change based on improvements or adjustments to the compiler itself. Developers typically don't have direct control over it.
Why do we care what stays on the heap?
Memory allocated on the heap is reclaimed through the process of garbage collection, which can sometimes be an expensive process, causing latency.
The garbage collector periodically scans the program's heap, looking for objects that are no longer reachable. Once the garbage collector determines that an object is no longer reachable, it will release the memory associated with that object and make it available for reuse. It is a concurrent operation, which means it runs concurrently with the application's execution. However it has stop-the-world (STW) phases where all the application’s goroutines are paused. The duration of these pauses is influenced by factors such as the size of the heap and the activity of the program.
When a collection starts, the collector runs through three phases of work:
Mark Setup - STW
At the start of a collection process, the initial step involves activating the Write Barrier. The Write Barrier serves the purpose of ensuring data integrity on the heap throughout the collection, as both the collector and application goroutines operate concurrently.
To enable the Write Barrier, it is necessary to halt every currently running goroutine. Typically, this interruption is swiftly executed, averaging between 10 to 30 microseconds, provided that the application goroutines are functioning as expected.
Marking - Concurrent
Once the Write Barrier is turned on, the Marking phase is started.
The collector uses CPU resources to scan and identify unreferenced objects, trace the object graph, and perform other necessary tasks.
The Marking phase involves identifying and marking values in heap memory that are still in use. This process starts by examining the stacks of all active goroutines to locate root pointers leading to heap memory. Subsequently, the collector traverses the graph of heap memory starting from these root pointers.
starts with a set of "root" objects, such as global variables, and then "traces" the pointers from these objects to other objects, marking all of the objects that are reachable. Any objects that are not marked as reachable are considered garbage and are eligible for collection.
Mark Termination - STW
Once the Marking work is done, the next phase is Mark Termination, when the Write Barrier is turned off, various clean up tasks are performed, and the next collection goal is calculated.
Go’s Escape Analysis
Escape analysis determines whether the variables can reside on the stack or should be escaped to the heap during the compile time. It tries to keep variables on the stack as much as possible. If a variable is allocated on the heap, the variable is escaped (from the stack).
In performance-critical domains where you want to maximise the efficiency of your application, having a thorough grasp of Go’s escape analysis can prove highly advantageous.
The way a variable is used - not declared - determines whether it lives on the stack or the heap.
Sharing up (returning pointers) typically escapes to the heap.
Go encourages the use of value types, which are allocated on the stack, as they don't require garbage collection.
Variables escape to the heap when their lifetime extends beyond the function or scope in which they are defined. This can happen when the variable is returned from a function or stored in a data structure that outlives the function. Garbage collection is responsible for reclaiming memory occupied by variables that have escaped to the heap.
Here's a simple example to demonstrate variable escape and garbage collection:

If we run go build -gcflags=-m main.go we can see which variables will escape.
# command-line-arguments
./main.go:23:22: moved to heap: user
./main.go:18:21: ... argument does not escape
./main.go:18:63: func literal does not escape
The createObject function creates a UserData object and returns a pointer to it.
In the
mainfunction, a loop calls createObject repeatedly, and the returned pointers are assigned to the user variable.The
uservariable escapes to the heap because it is returned from the createObject function.
We can investigate the effects the above code has on the heap. If we run the above code, the defer profile.Start(profile.TraceProfile, profile.ProfilePath(".")).Stop() will generate a file called trace.out which we can investigate by running
go tool trace trace.out
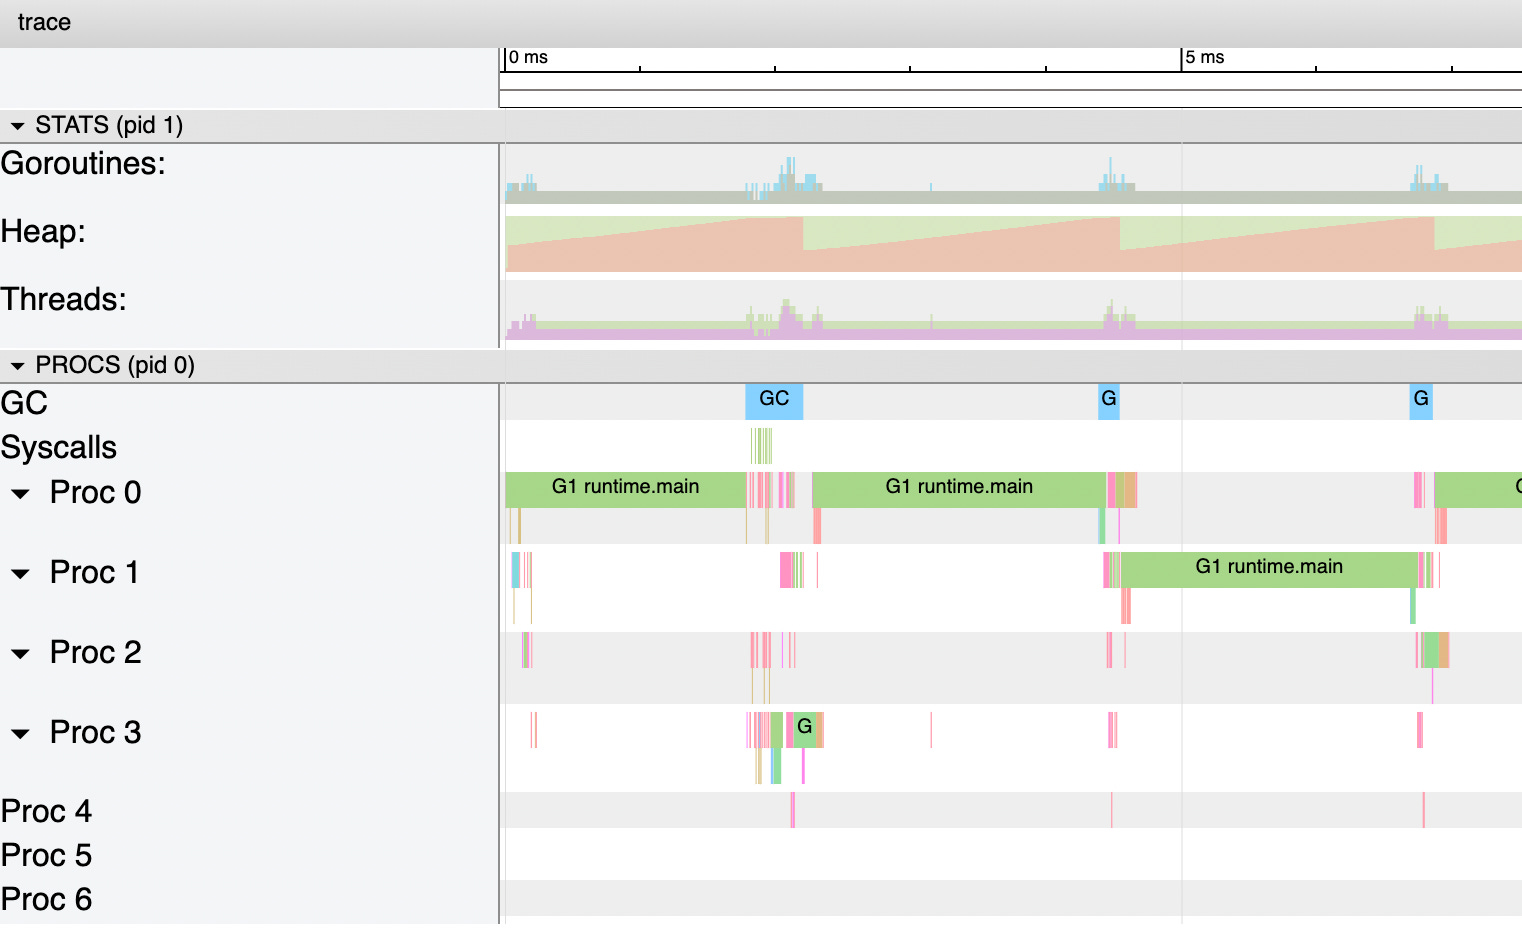
You can notice the heap starts increasing with time and at a certain point, the GC runs and cleans up the heap, before it starts growing again.
If we modify the above example so that the createObject function directly returns the UserData object instead of a pointer to it, we can see the variable no longer escapes.

This time if we run go build -gcflags=-m main.go and go tool trace trace.out we get:
# command-line-arguments
./main.go:10:6: can inline createObject
./main.go:16:63: inlining call to profile.ProfilePath
./main.go:20:22: inlining call to createObject
./main.go:16:21: ... argument does not escape
./main.go:16:63: func literal does not escape

Now, the createObject function returns the UserData object directly, and there's no need to use a pointer. This ensures that the UserData object is allocated on the stack within the loop, preventing it from escaping to the heap.
Other examples of variables escaping
Generally, a variable escapes if:
its address has been captured by the address-of operand (&).
huge objects
For explicit declarations (var or :=)
The variables escape if their sizes are over 10MB
For implicit declarations (new or make)
The variables escape if their sizes are over 64KB


a slice variable escapes if its size is variable and not constant

return values if:
they are pointers
they are of map or slice types

closure functions - a variable escapes if the source variable is captured by a closure function

Before we go, if you ever found it difficult to read the cli results of the go build -gcflags=-m, here is a command line tool that translates the escape analysis results into a human-readable format to output which variables will be stored on the stack and which on the heap. Code available on github.

Conclusion
While the garbage collector introduces some overhead, it also provides memory safety and automatic memory management, reducing the risk of memory-related bugs. If you have specific concerns about stack vs. heap allocation for performance reasons, it's recommended to rely on profiling and benchmarks to identify potential bottlenecks in your code. The Go runtime and compiler are designed to handle memory allocation efficiently, and the decision of stack vs. heap allocation is part of their optimisation strategies. Premature optimisation can lead to various issues. Only optimise services when they have performance or cost issues. In most cases, you don’t need to worry about where variables are allocated, as the garbage collection knows what it’s doing.