
Building an Audit Logging Solution: Production Scars and Evolutionary Architectures
On lessons learnt when mvps and balancing trade offs aren't enough

System design is making tough trade offs and understanding why one approach is better than another. Sometimes this decision ends up being the wrong one. So you need to live with the consequences and make another trade off, do you start from scratch and take another approach or do you live with a not so perfect solution?
As reflection is an essential part of the learning process, this article is all about acknowledging that even with the right intentions and much dedication, you don’t always get it right. This is about accepting this reality and reminding myself that growth is a learning curve and despite setbacks we need to continue to take ownership.
What problem did we try to solve?
Maintaining accountability within data-driven systems along with keeping track of who did what and when within isn't just a security requirement—sometimes it's a crucial business necessity. Whether if it’s just for meeting compliance requirements, troubleshooting and understanding system behaviour, investigating production incidents or providing insights for post-mortem analysis, a robust audit logging solution serves as your system's source of truth.
But building such a solution comes with a lot of challenges in terms of scalability, performance and most of all, data integrity. In this article, we’ll explore what are the possible approaches to implement such a system that captures meaningful events, stores them reliably, and makes them easily accessible when you need them most. We'll cover the essential components that make up a production-grade audit logging solution and emphasise some lessons learnt from implementing a “tamper-proof solution”.

What is an audit log?
We want to know all database interactions that happened during a period of time, along with detailed information about each event. Those logs should be queryable and be able to answer questions like "who changed this value" or "which process caused this item to be removed." Audit logs record the occurrence of an event, the time at which it occurred, the responsible user or service, and the impacted entity.
A good audit logging system should not only record event data but also consider various usability criteria for the teams inspecting the logs (i.e the end users) and the future maintainers (e.g. engineers) of the system. The main requirements we’re going to work with:
audit logs should be reliable - any database change should have a corresponding audit log entry.
have no or minimal setup - should be easy to set up across the ecosystem and ideally require no or minimal code changes for new services.
audit logs should be immutable - users and services should only have the ability to read data the logs and not update them.
audit logs should be easily queryable (by service, action, date, user etc) - users must be able to efficiently search through the logs by applying any one or more filters.
audit logs should be parsable - logs should also be easy to parse and work with.
Since the ecosystem we work with is only using DynamoDB as a storage option, we’ll design the audit log solution to work especially with this kind of database.
Solutions Considered
1. via the Transactional Outbox Pattern
One solution to implement the audit logs would be to emit an event with every database change. This event would contain all the necessary information to track the change (what got changed, who changed it etc). The consumer of those events would process the data and store it in a way that would be easily accessible and queryable by all devs.
In our current ecosystem, we use an internal library go-kit (similar to the open source one go-kit) to help us with the scaffolding and management of our golang microservices. This library also provides a standardised way for doing all db interactions. This approach would mean just modifying this library to emit an event when doing a CRUD operation. The advantage would be services don’t need to be aware of this logic and no logic would need to be updated.

The problem with this solution is the general dual-write issue where you want to make 2 write operations in one atomic transaction. If we want to update 2 different systems, persist data in the database and send an event to notify other systems, because these two systems aren't linked, we have no way to update both in a transactional fashion. When a microservice sends an event notification after a database update, these two operations should run atomically to ensure data consistency and reliability.
The way to solve this is usually through the Outbox Pattern. If we have a database that supports transactional updates, then we can use it to overcome the dual-write problem. In our case, we would need another table, say an “Outbox Table“, and on a DB CRUD operation we would 1. do the CRUD operation and 2. save the change we did in the outbox table (both as part of a transaction which DynamoDB supports). The records in the outbox table will then be read by some workers which will emit an event with the changed data. The events will be read by an “Auditor Service“ that will process them and finally store them in a queryable way.

This approach comes with a fair bit of complexities. We would have at least one other table (we can choose to use one single outbox table for all services or create a seperate outbox table for each service). We would introduce some latency due to the additional database write for every transaction (to outbox). There is also the consideration of how we’re going to manage the outbox table growth/cleanup. We would need to think how to coordinate the allocation of work between the worker services.
2. via the CDC Approach
A second solution would be relying on a Change Data Capture (CDC) approach. CDC is the process of identifying and capturing changes made to data in a database and then delivering those changes in real-time to a downstream process or system). The basic idea is that we will store our data to a storage that supports CDC. Then the CDC infrastructure will notify external systems of the changes. Fortunately for us, DynamoDB provides such an option, called DynamoDB Streams.
DynamoDB Streams captures a time-ordered sequence of item-level modifications in any DynamoDB table and stores this information in a log for up to 24 hours (can be extended to 7 days). Applications can access this log and view the data items as they appeared before and after they were modified, in near-real time.
At first glance this approach sounds like a good solution for our use case. No other resources are required to be setup. DynamoDB provides a CDC capability out of the box. Scalability and reliability are provided natively by AWS. The code what we would need to add would be minimal as we just need a service which reads the data from the dynamodb streams. So we went ahead with this.
What’s in a DynamoDB Stream?
Any dynamodb table with dynamodb streams enabled can have one dynamodb stream active. At any point in time, we can only have one active stream. A stream can have multiple shards. A shard can contain zero or more records. A record is the change that we want to be captured.

Depending on how the stream was set up when it was enabled, the shard record can contain different types of data (source):
KEYS_ONLY- Only the key attributes of the modified item are written to the stream.NEW_IMAGE- The entire item, as it appears after it was modified, is written to the stream.OLD_IMAGE- The entire item, as it appeared before it was modified, is written to the stream.NEW_AND_OLD_IMAGES- Both the new and the old item images of the item are written to the stream.
We’re interested in the last type, NEW_AND_OLD_IMAGES, and so in our case, we’re expecting our record to look similar to the following:

Costs
DynamoDB Streams does not cost anything to enable. DynamoDB charges on the number of read requests made towards the table’s DynamoDB Stream. Each read request in terms of the stream is in the form of a GetRecords API call that can return up to 1000 records or 1 MB worth of records in the response, whichever is reached first. None of the other DynamoDB Stream APIs (source) For DynamoDB Streams the cost is $0.25 per million reads.
Approaches to Reading from Streams
DynamoDB streams can be processed in multiple ways. The most common approaches (source) are:
trigger based via AWS Lambdas
polling based with a standalone application that uses the Kinesis Client Library with the DynamoDB Streams Kinesis Adapter
polling based with a standalone application connecting directly to the Dynamo Stream APIs through the AWS SDK
The AWS Lambdas Approach
Amazon DynamoDB comes integrated with AWS Lambda so that you can create triggers—pieces of code that automatically respond to events in DynamoDB Streams. Lambdas will poll the DynamoDB stream and, when they detect a new record, invoke your Lambda function and pass in one or more events.
Under the hood though, the AWS Lambda service will poll the stream for new records four times per second. (source) The polling interval cannot be changed, you can only change things like the batch size or the parallelization factor. (source)
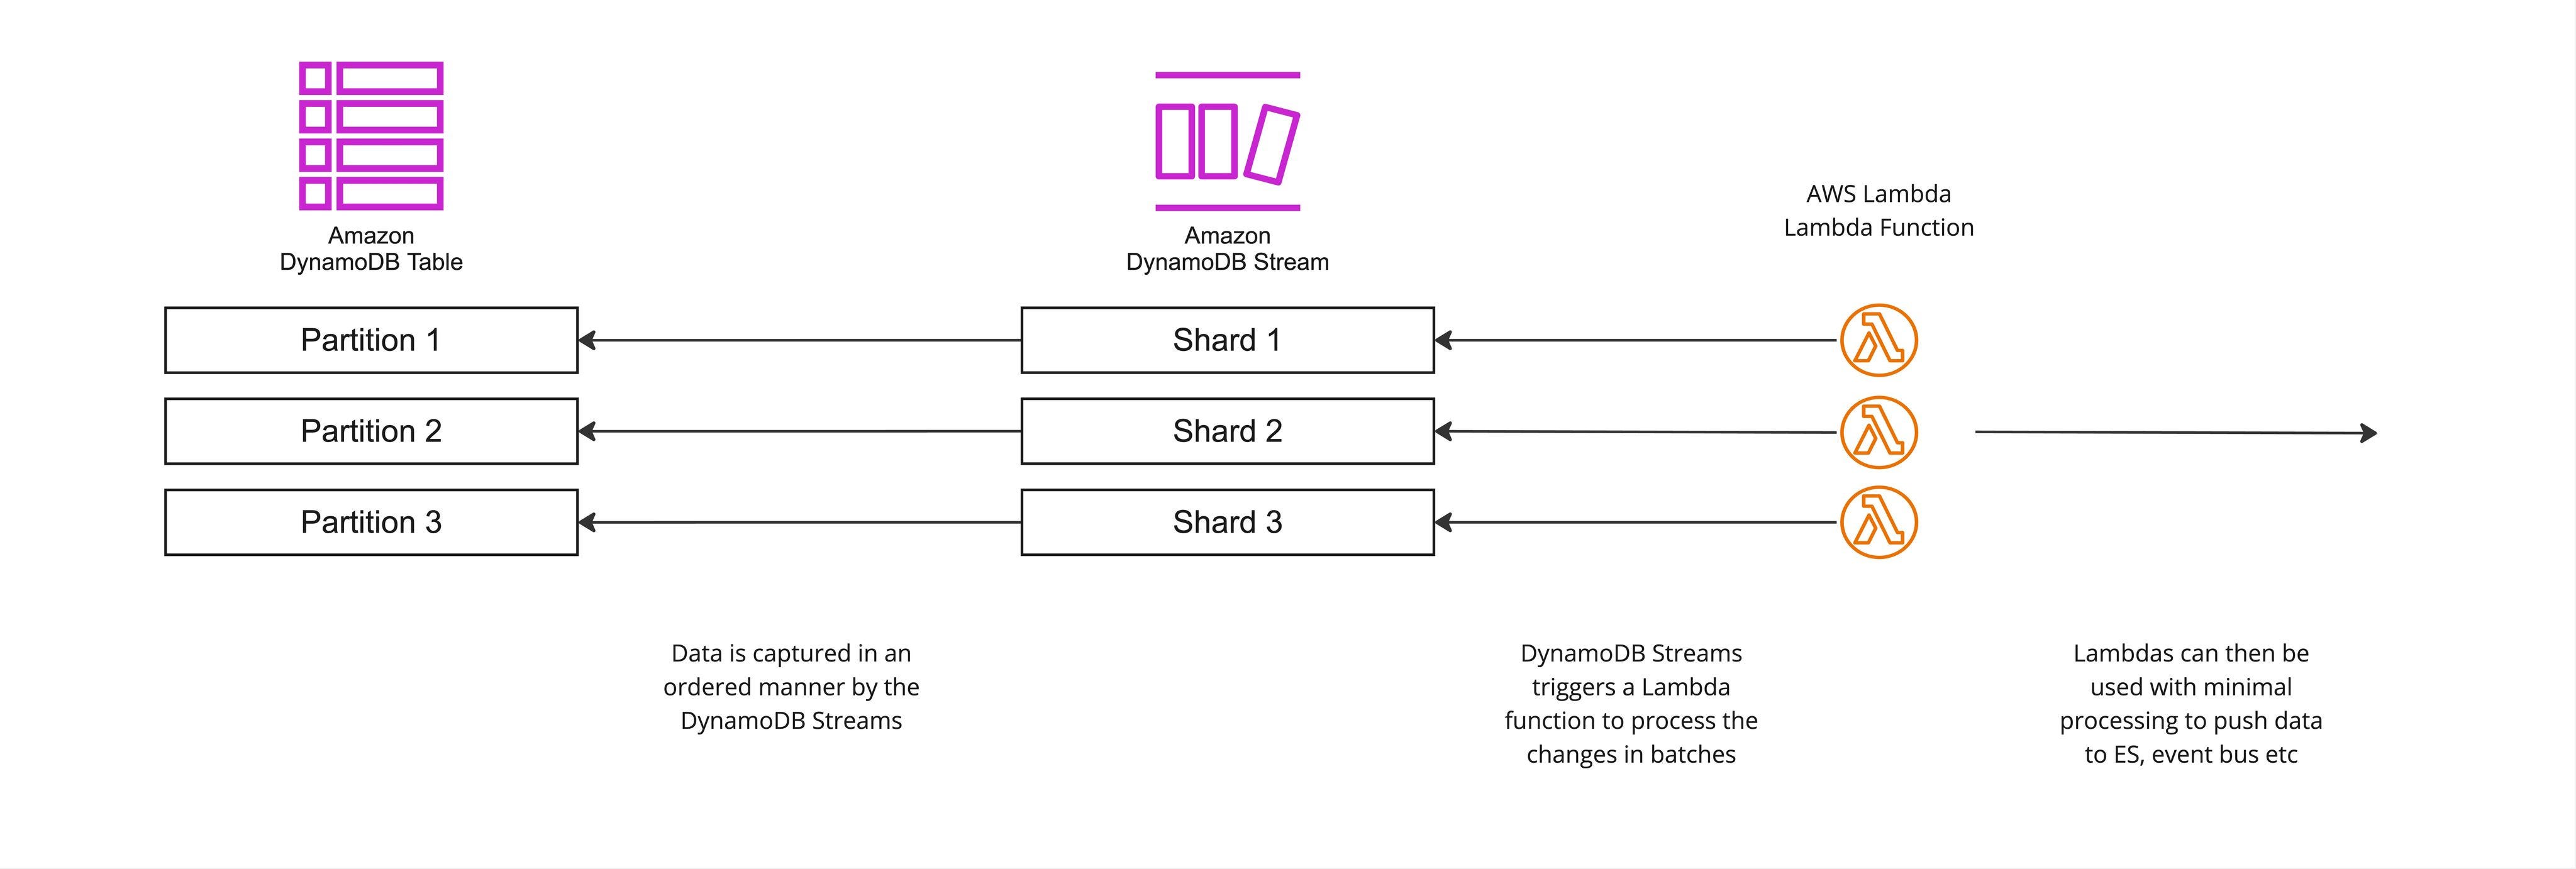
Going with this approach would have a couple of advantages. The polling logic for data streams is automatically managed by Lambda functions, removing the need for manual implementation. Lambda functions provide built-in autoscaling capabilities, handling varying workloads efficiently without manual intervention. When using Lambda functions, you avoid the costs associated with making GetRecords calls to the streams, as this is handled by the AWS infrastructure.
On the other hand, there are significant additional costs involved, with an estimated expense of approximately $194 per month when handling 100 tables. The setup process requires extra effort, introducing changes to the deployment topology and adding complexity when establishing new data pipelines. Observability is limited as CloudWatch is the only available tool for monitoring and understanding what occurs within Lambda functions. Lambda functions must be designed to execute quickly, with minimal processing time, making them unsuitable for complex or long-running operations within the function logic.
Using the DynamoDB Streams Kinesis Adapter
The Amazon Kinesis Adapter is Amazon's recommended solution for consuming DynamoDB streams. However, a significant limitation is that this adapter is exclusively available in Java, making it unsuitable for non-Java applications. The Kinesis Client Library (KCL) offers a higher level of abstraction above the basic Kinesis Data Streams API, making the development process more straightforward and efficient. It provides robust batch processing capabilities, enabling efficient handling of multiple records simultaneously. The library includes automatic checkpointing functionality, maintaining accurate records of which data has been processed without requiring manual tracking.
The most significant limitation is that the DynamoDB Streams Kinesis Adapter is only implemented in Java and available through the awslabs/dynamodb-streams-kinesis-adapter repository, making it inaccessible for applications written in other programming languages.

Directly through the Dynamo Streams APIs using the AWS SDK
The third option is to have a service that constantly polls the streams for new records using the available aws sdk for go. This has a couple of implications, we need to keep track of an index to know which records have been processed so far and due to the replicated nature of our systems, we need an idempotent way to achieve this.
And some things worth considering:
Streams have rate limits - the DescribeStream endpoint can be called at a maximum rate of 10 times per second; the GetRecords endpoint can be be called at 5 TPS per stream shard or 2MB/s, whichever comes first (source). Therefore, we cannot read more than 10 streams per sec.
You cannot have more than one active stream per table.
DynamoDB streams guarantee no duplicates and ordering of records.
Implemented Solution
Most of the time reinventing the wheel is the worst solution you can choose. But what do you do when the current company policies and/or ecosystem makes it hard to integrate these libraries or this new set up in particular? Do you use the existing wheel but build a completely special car to work with it, or build a new wheel that fits into your existing car? All of the sudden, crafting this new wheel sounds like the easiest option. So here we are, reinventing the wheel because…it looked easy enough.
Polling Processing Logic
Before going into the high-level overview on how we’re using the aws go sdk to continuously poll the Dynamo Streams APIs, a couple of key concepts on how DynamoDB Streams work (which took us quite a lot of searching, digging and calls with AWS Support):
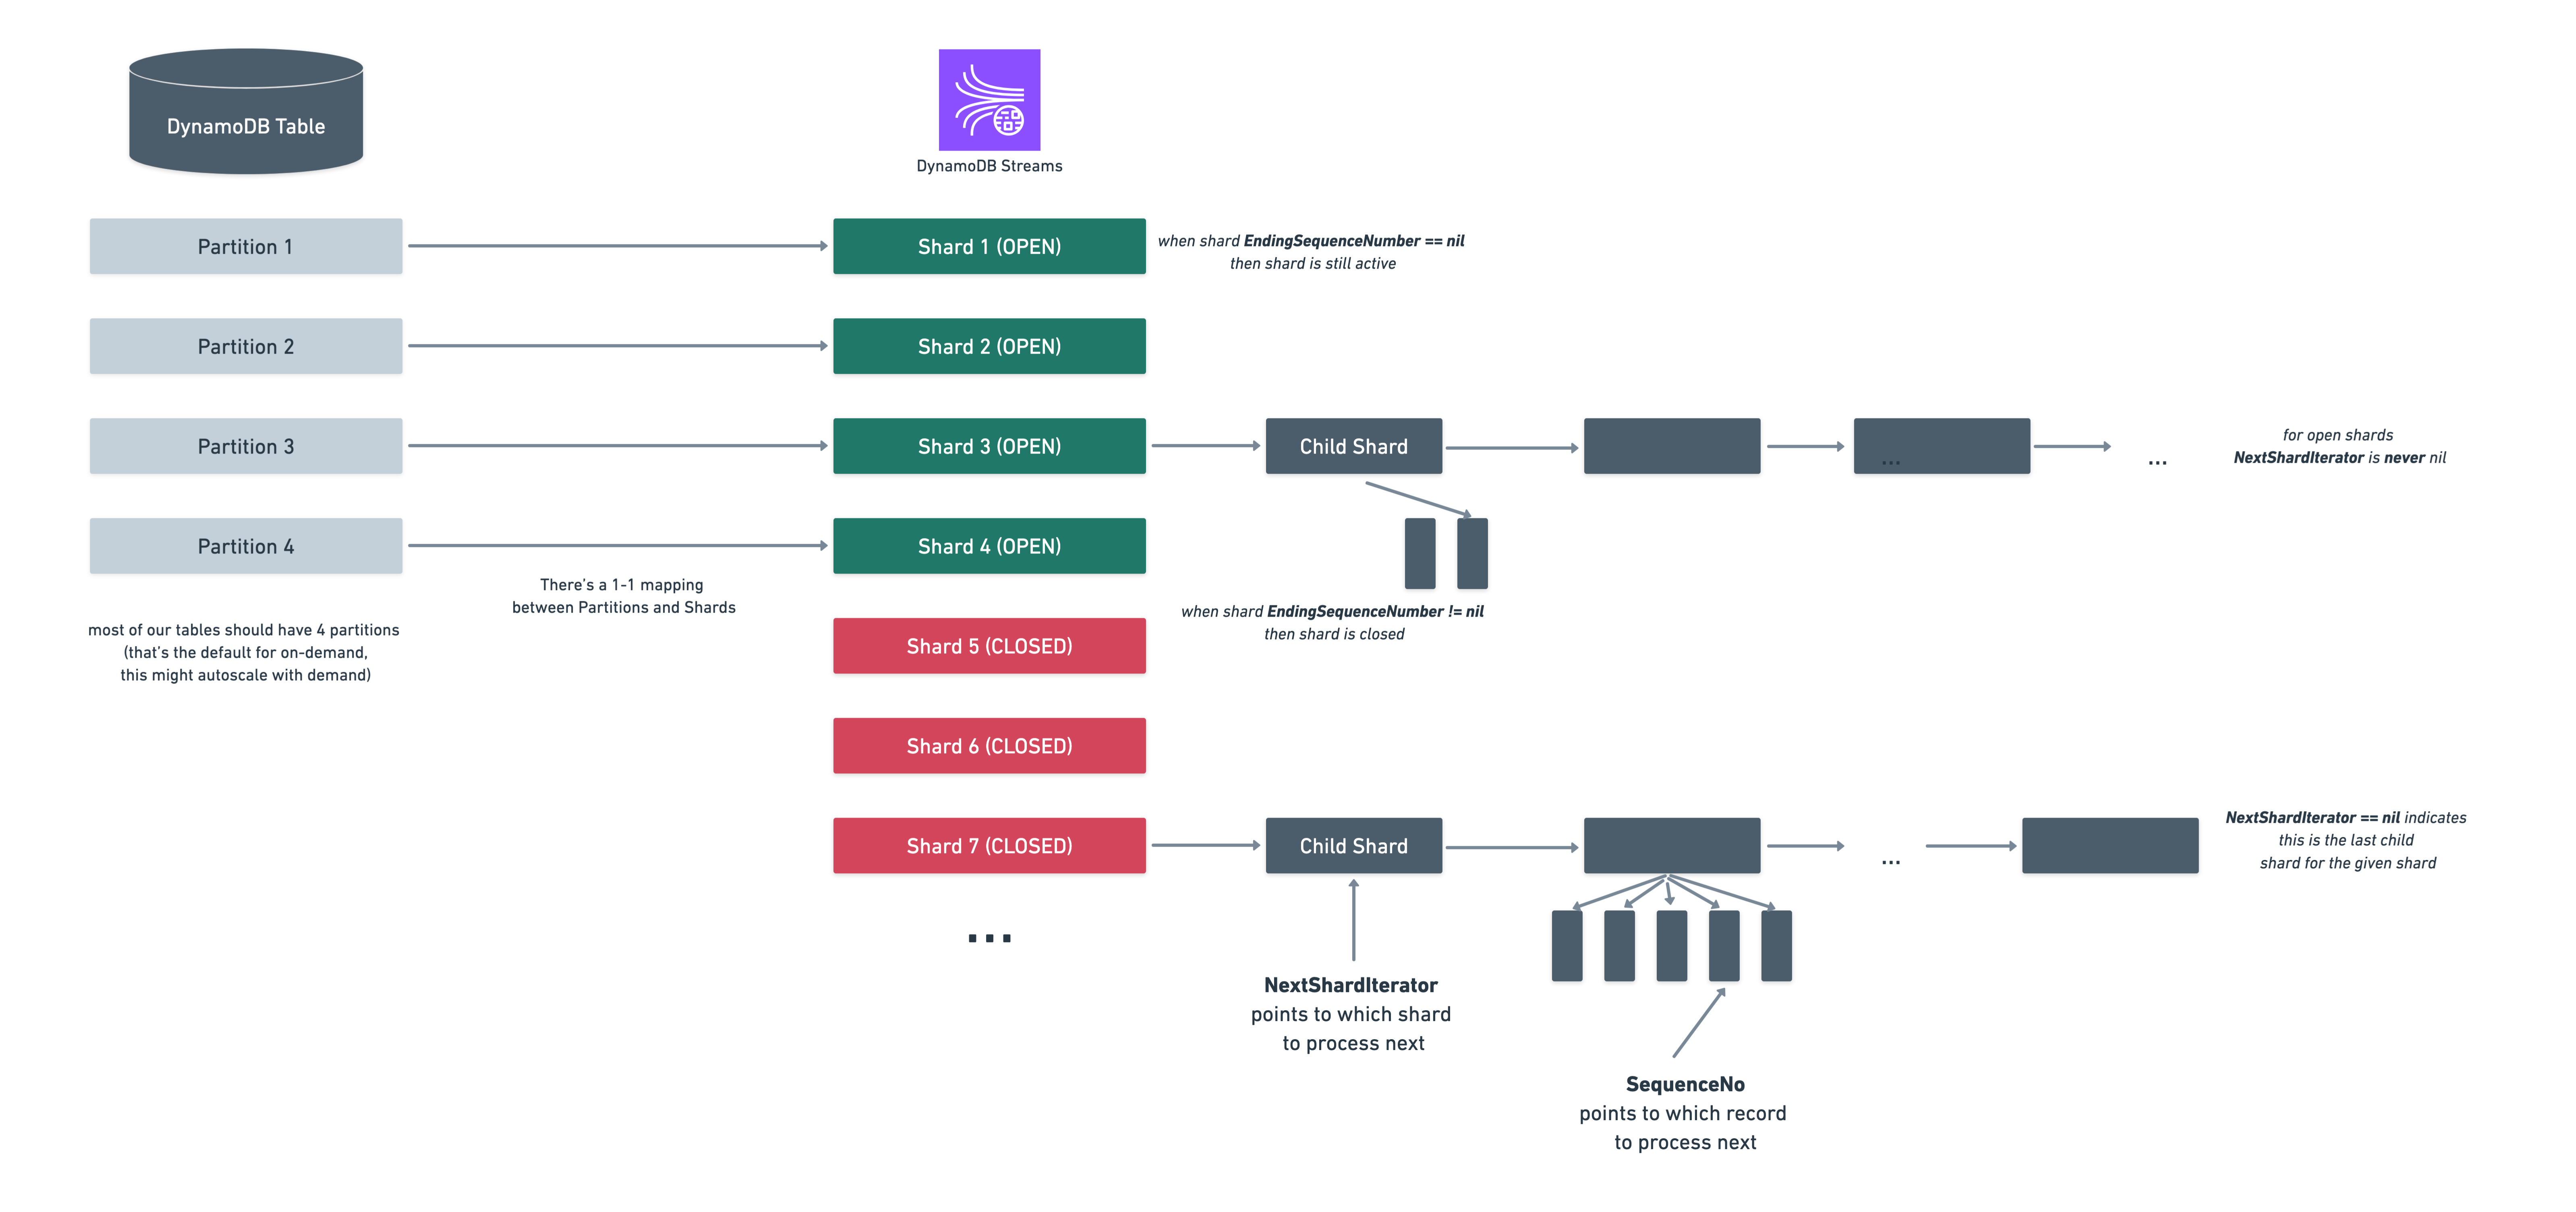
We can have 2 types of shards: OPEN and CLOSED.
There is a one to one mapping between the dynamodb table partition and an open shard.
A shard is OPEN if EndingSequenceNumber == nil and CLOSED otherwise.
A shard can have (a lot of) successor shards (but every shard can only 1 child)
for CLOSED shards, you can iterate through all its successors until you get to the end denoted by NextShardIterator == nil.
for OPEN shards, NextShardIterator is never nil.
Every shard (parent or child) can contain records and the SequenceNo is a pointer to that shard record.
We will store some shard/record information to be able to keep track of where we left off:
a streams table - containing the table_name (which is the dynamodb table name we’re going to audit log), is_enabled (whether the dynamodb streams are currently enabled for it) and stream_arn (which is dynamodb stream identifier for the stream)
a streams_shards table - containing the stream_arn, shard_id (the identifier of the stream shard), sequence_no (the sequence number of the given shard which we will use to know when in the shard we left off processing, similar to how an index works) and status (which for us can be open meaning the shard is still open on dynamodb side, closed meaning the shard is closed on dynamodb shard but we still have records left to process and closedAndProcessed meaning the shard is closed on dynamodb side and we have processed all records)
The way our processing logic will work is that given a stream_arn:
we get a list of all the parent shards with their dynamodb statuses.
if it's dynamodb CLOSED:
we check if we have already processed all records in it (where our status is closedAndProcessed) and if so skip
otherwise (where our status=closed) loop through all the successor shards until NextShardIterator == nil, process all the records in them and update shard status to closedAndProcessed.
if OPEN:
loop through the shards using NextShardIterator.
Our main issue is what do we do with open shards, since NextShardIterator is never nil? When do we know when to stop? At first, we made the assumption that if we get to a couple of consecutive shards with 0 length records, we can assume the shard is caught up. Unfortunately, this is not the case (confirmed with AWS Support team). Even if we encounter multiple consecutive shards with 0 records, it's generally recommended to continue iterating through subsequent shards, as we can have data in later shards. Now you would say, that’s not a big deal, just continuously loop and if you see new records, save those. To point out, you might not need extra logic here for making sure you’re not processing duplicate records, remember we’re always storing the map of shard_id with sequence_no. So when you’re processing a shard that’s already been seen, we’re going to start from the given sequence_no.
The problem with this approach is that we don’t have just a couple of dozens of successor shards for open shards, we proved to have a couple of thousands. A couple of thousands with zero records in them. This is for a table with quite a reasonable (not very high) throughput. Overall, this overcomplicates our approach quite a bit as the time it takes to complete doing a full read looking for new changes increased significantly.
How is dynamodb streams spinning successor shards so chaotically? Why do we have so many with zero records in them? Why aren’t records written sequentially, why do we have large “gaps” (zero length record shards) in between shards with data? Would love to get an answer to those questions. We ended up not getting one so far.
Lessons Learnt
Even though every project starts with an MVP to prove the feasibility of the solution, as it started in this case, it might be worth to do a test on a production scale environment. If we would have faked production workload on local/staging to test the MVP, maybe we would have noticed some of the issues and started asking questions at an earlier stage.